Colour Management - Part Twenty One
Kiran Prayagi, print technologist and chairman, Graphic Art Technology & Education demystifies colour management in a series of articles. In this twenty first article, he discusses spectral colur evaluation.
01 Oct 2013 | By Kiran Prayagi
Complete colour evaluation is only possible through spectral colour evaluation as the colour is measured considering spectral reflection or transmission values at wavelength intervals of 20, 10, 5, or 1 nanometers throughout the visible spectrum, see figure 1.
Figure 1 - Colour spectrum
The tristimulus colour measurement is based on the idea that the spectral sensitivity of the three cone receptors in the human eye is well described by the CIE specifications. Accordingly, it is possible to measure colour by means of three sensors whose spectral sensitivities are similar to those of the receptors of the human eye.
If the three colour filters whose transparency corresponds to the standard spectral value curves and if the sensor is ideal across the entire visible spectrum and if light conditions are perfect, makes the concept of the tristimulus process attractive that only three measurement values must be established, which then can be directly converted to the CIE standard colour values.
In practice, the development of colour filters corresponding to the exact characteristics of the relevant standard spectral value curves still presents some difficulties. The spectral radiation distribution of the light source used is a critical variable. It should correspond as closely as possible to the specified standard illuminant. Tristimulus colorimeters are only really perfect if all conditions within the device (lighting, colour filters, sensor, reproduction geometry, etc.) ideally reflect the standardized measurement conditions, only then will the simplification criteria for the direct derivation of CIE standard colour values produce accurate values corresponding human visual perception.

Figure 2 Colorimeter
The colour values derived from the colorimetric measurement are only valid under the prescribed general conditions (illuminant, observation angle, etc.). The device establishes only the integral of the light intensity across the spectrum. By comparison, spectrophotometers establish the light intensity in small intervals, allowing it to be converted to other conditions in accordance with the CIE specifications.
Spectrophotometers measures the visible spectrum in small intervals, and the light intensities are measured separately at certain wavelength intervals depending on the spectrophotometer. Most commonly used spectrophotometers operate with 10 nm intervals, so that roughly 30 individual light intensities are calculated across the visible spectrum. For some requirements more sophisticated systems at much smaller intervals (down to 1 nm) can be measured, but the common 10 nm intervals in lower-priced devices are sufficient for measuring colours in day-to-day practice.

Figure 3 - Spectrophotometer
Subsequent processing of the spectral intensity data is generally followed by a mathematical simulation of the three receptors of the CIE standard colorimetric observer under a specified illuminant and at a defined observation angle. This way the 30 or more channel signals are reduced to the defined quantities CIEXYZ for colorimetric evaluation and can be converted subsequently for use in other colour systems. The software of modern spectral colour measurement devices allows direct conversion of the spectral data to the colour systems commonly used and described under colorimetry description earlier.
Some colour effects, such as metamerism, fluorescence) or insufficiencies of the optical measuring system can frequently be detected with the aid of the spectral measurement data, and eliminated with corresponding compensation calculations.
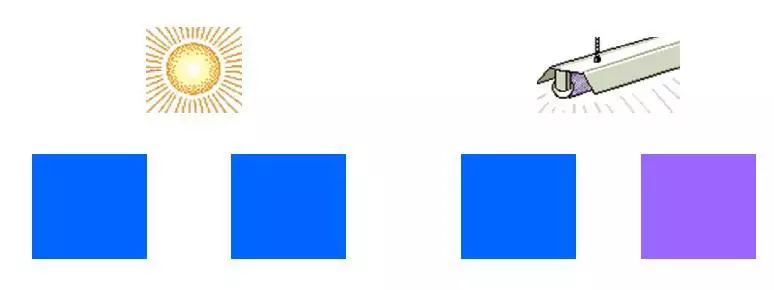
Following are some of the examples of colour measurement where results are compared with the colorimetric as well as spectrophotometric measurements. It can be seen that if colour is matched colorimetrically under one light source may look different under another light source, but if match is made spectrally then both colours will look alike under all light sources.

Figure 4 - Metameric effect
Colour patches in figure 21 were measured colorimetrically for Lab values and then measured spectrally with spectrophotometer and then spectral values were converted to Lab values. The colour patches with yellow border have difference between colorimetric measured Lab values and spectrally measured and then converted to Lab values. Both the measurements were made using the same instrument GretagMacbeth Spectrolino. First it was used as a colorimeter and then as a spectrophotometer.

Figure 5 - Colorimetric Lab vs spectral values converted Lab
Thus spectral measurements give more complete information about colour and should be used for dyes and pigments in sample matching.
After having discussed many fundamentals in great detail, from next article ‘Colour Management’ fundamentals and its mechanism will be dealt with.


 See All