Colour: Nature to paper - The Noel D'Cunha Sunday Column
You are on a holiday to an exotic place in Europe. You spot a beautiful apple orchard. You look at the apple, take a picture and as a printer, you decide to reproduce the exact image of the apple for one of your print products. You want your production team to get this idea implemented. How do you do it?
Manu Choudhury, director at CDC Printers, and a print technologist from Rochester Institute of Technology, USA, says, understanding colour is a complex business. “We mix colour manageme
25 Mar 2017 | By Noel D'Cunha
Do we really understand colours?
In order to find an optimum solution for reproducing colour from nature to paper, we must understand what is colour, what factors influence and how we perceive colour. Since we plan to have control on capturing and reproducing colour, it is of utmost importance that we should be able to measure it in an unambiguous fashion.
What is colour?
It’s visual sensation and is dependent on light source, object and the observer.
Take, for example, the image below.
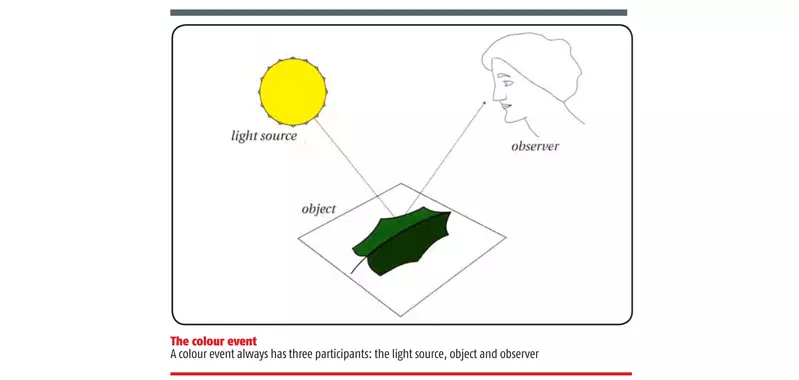
The illustration shows how the two sides of a leaf appear to be of different shades of green to the same observer because light falling on the both the sides are not equal. This tells us about the influence that the light source can have on the perceived colour. Also, we notice that it is the property of pigments in the leaf that absorbs all the light falling on it but reflect light rays having wavelengths corresponding to the green colour. Now if the observer is colour blind to green, then the colour of leaf would not appear green to him.
Thus all three parameters – the light source, the property of the pigment and they reflect light rays, define what colour is perceived by the observer.
Even though the colour may seem to be an artistic phenomenon of nature, in reality, to understand colours we need to understand its physics, chemistry, and also biology.
The physics – Wavelength of an electromagnetic ray determines its nature.
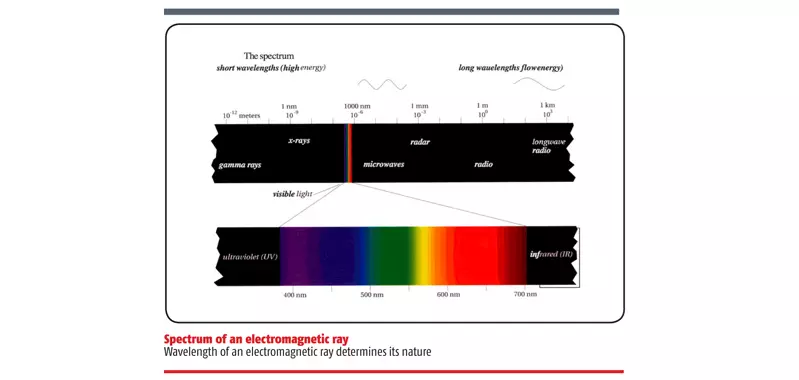
Electromagnetic rays have a huge spectrum. The ray has a highest wavelength of 1,000 metres, whereas the one with the smallest wavelength is of 10-12 metres. Many properties of electromagnetic rays are common, for example, speed, transmission method etc. Some of their properties change with the change in wavelength. One of those properties is visibility. Light ray having wavelengths in the range of 400-700nm (nanometre) are visible to a naked human eye. It is the physics of electromagnetic rays that determine these properties.
The chemistry – The molecules/atoms of an object determine its absorption/reflection property.
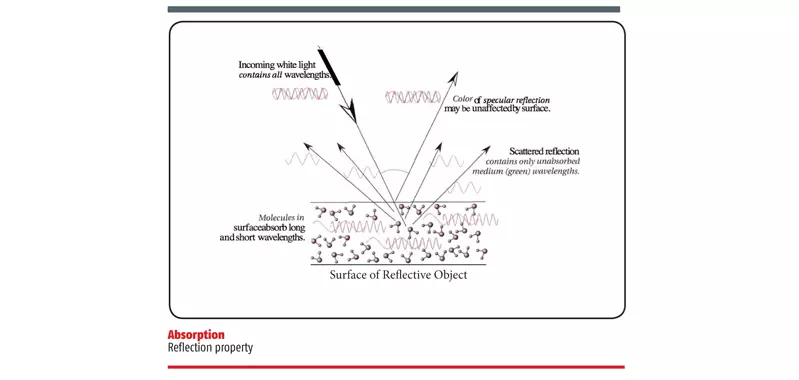
Chemistry explains why chlorophyll present in the leaves appears green. It is because of the molecular and atomic structure of chlorophyll decides what light rays to absorb and what to reflect back. In the figure above, the rays with long and short wavelengths are absorbed and rays with medium wavelengths are reflected back. That is why the object appears green.
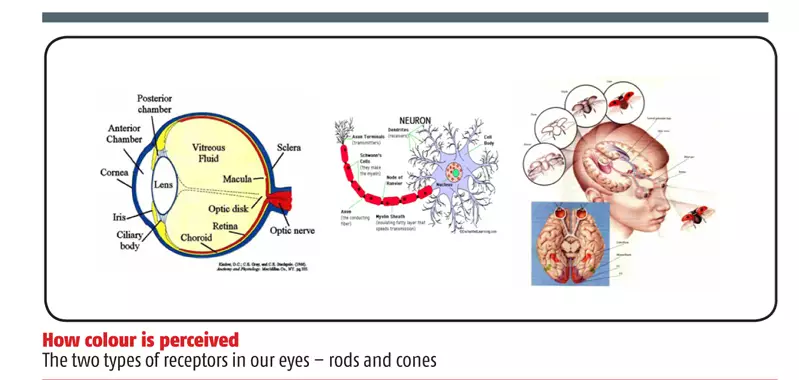
The biology - How an observer perceives the incoming ray of light is explained by neurophysiology of the eye and brain.
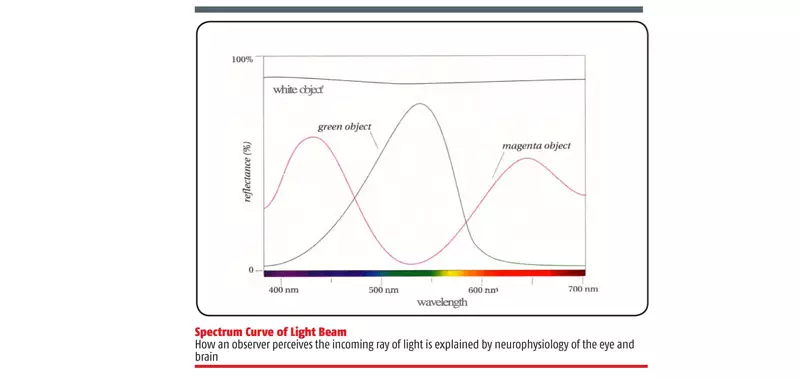
Spectral curves of the light beam reflected on three objects: individual light ray is of a specific wavelength, ie, they have a specific colour. Suppose we want to display a colour corresponding to 600nm (as per above diagram). It is not possible in practical scenario to emit light rays of a specific wavelength. A beam or a collection of light ray consists of rays having many wavelengths. Spectral curve of light beam reflected off three different objects are shown in the image above. We can see, all beams consist of rays having a wide range of wavelengths. Rays reflected off green objects contain rays across the spectrum, but the majority of them are in the range of 500-600nm.
How is colour perceived?
There are two types of receptors in our eyes – rods and cones. Rods are used for low light vision, where are cones are used for registering colours.
There are three different types of cones – red, green, and blue. Each of these cones reacts to light rays in the specific range. For example, red cones react when red light falls on our eyes.
For understanding, they can be treated as three types of sensors. Different people have different densities of these three types of cones. Moreover, their strengths or sensitivity also differs from person to person. That is why same light ray falling on two observers result in them perceiving the colours differently.
That is why we see that even the observer is very important when defining colours.
How to measure colour?
Why RGB and CMYK cannot be used to measure colour? Because they are device dependent, and thus RGB of one monitor would be different from another. Same for CMYK. So communicating colour data through RGB or CMYK is inaccurate.
Colour perceived by a person seeing a colour patch of a specific RGB value on one device, and another person seeing another colour patch of the same RGB value on a different device would be different. Similarly, two printers printing colour patches of same CMYK values would print them differently. So if same value results in two different colours, how can those values be used to measure.
Density/dot gain does not measure colour. They only measure an amount of light reflected and not the colour of light that is reflected. Density/dot gain only used for process control. They have no colour data.
Accurate measurement of color involves measurement of all three parameters that affect the perception of colour.
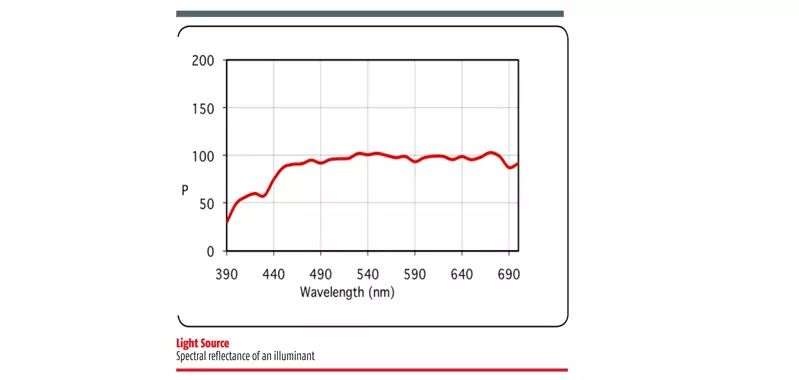
1) Light Source – figure below shows spectral reflectance of an illuminant
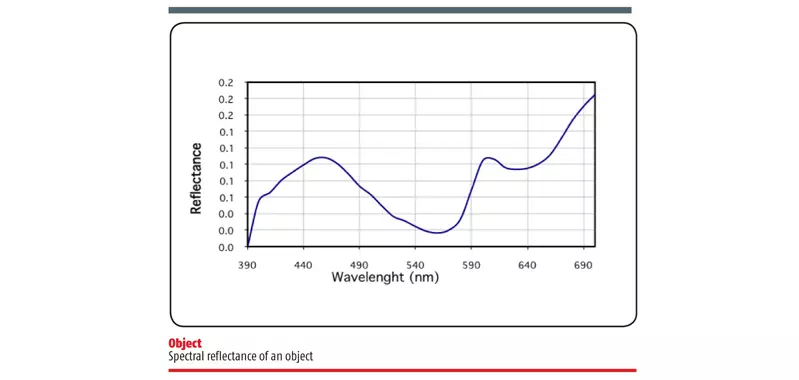
2) Object – figure below shows spectral reflectance of an object
3) Observer – figure below shows tristimulus values of a standard observer
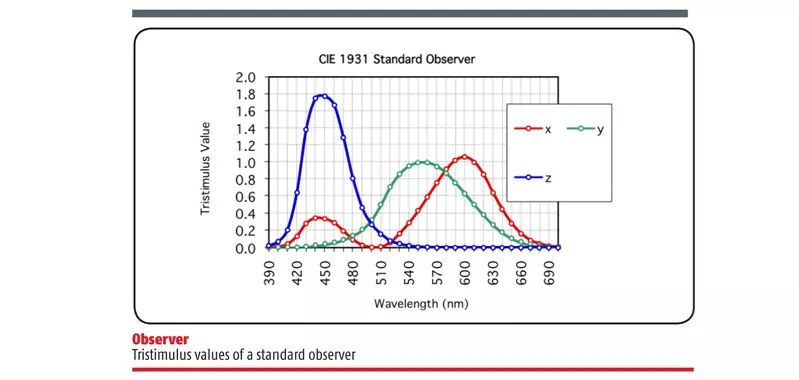
So in order to measure a color of an object perceived by a standard observer under a light source, we calculate the area under the curve when the three functions of wavelengths are multiplied to each other.
Mathematically, it can be represented as:
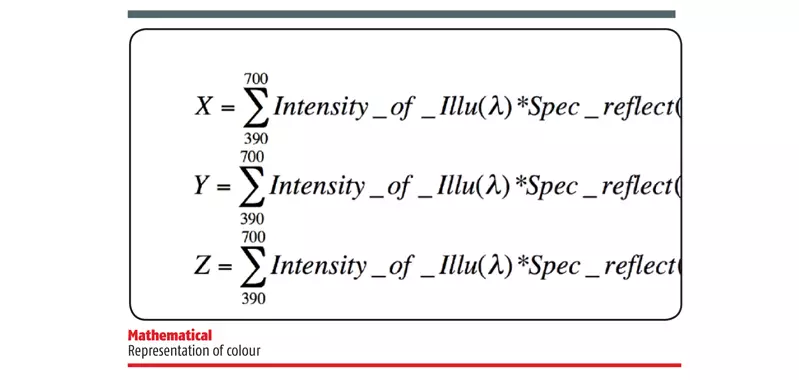
X tells us the amount of red, Y the amount of green, and Z the amount of blue a standard observer perceives when viewing that object under the specified illuminant.
This XYZ value is completely device independent and accurately measures colour.
The three dimensional XYZ colour space can also be converted to 2-dimensional XY colour space, where x=X/(X+Y+Z), y=Y/(X+Y+Z).
This two-dimensional space also contains complete colour information.
Introduction of LAB values
While XY or XYZ colour space (see pics below) though very accurate in measuring colour, is not used as often as LAB space. This is because as shown in the left image below, the colour difference of any two points in the graph is not perceptually uniform. That is why Lab colour (right image) space was introduced. Lab colour space is only a mathematical modeling of XYZ space. Thus it also contains all the information captured by XYZ values. However, it is also more perceptually uniform. The difference of two-colour points can be calculated by finding their geometrical distance in Lab colour space. This is not true for XY colour space.

Different colour systems
There are two systems – primary colour for the additive colour system: RGB, and primary colour for the subtractive system: CMYK.

In the additive system, the spectral distribution is added, ie, if we have to add two distributions, we take union of them.
In subtractive system, the spectral distribution is subtracted, ie, if we have to subtract two distributions, we take the intersection of them.
If we divide the complete visible spectrum (380-700) into three grids, we notice that R, G, and B all occupy single grid, where as C, M, and Y occupies two out of three grids.
Using the spectral data for RGB and CMY we can understand why additive system uses RGB and subtractive system CMY.
In the additive system, if we add cyan and magenta, we would get white as the union of two distributions contains rays having all wavelengths.
Same is true when we choose any two from cyan, magenta, and yellow.
Thus, in the additive system, it is not possible to produce blue using any two of CMY colours.
Similarly, in the subtractive system, it is not possible to produce cyan using RGB colours. The intersection of any two out of RGB results in no light, ie, black.
Capturing colour from nature
To capture colours from nature, we use a camera. The camera has sensors similar to human eyes. This sensor data is saved in camera as RGB values. But this RGB values independently makes no sense. In order to make some sense of these RGB values, we need an interpreter. This interpreter converts the RGB values into real colour values (LAB/XYZ). In order to accurately capture colour, we need an accurate interpreter.
Calibration and characterisation
Calibration and characterisation are ways used to create the desired interpreter.
Calibration is bringing the system to a known state, while characterisation means capturing known stimuli, comparing the actual response with target response and understanding the capability of the device. Characterisation plus sensor data is equal to image capture.
For characterisation, we take an image of colour chart, whose actual colour values we already know of. We store the input Lab value, and corresponding RGB values returned by the camera in a table. So this figure and table below tell the system that if the actual colour value is for example (5,8,12), the camera is going to return an RGB value of (79,207, 110).

Now when we take an image of nature, and the camera returns a list of RGB values, we match those RGB values from this table and try to find what might have been the actual colour value for which this RGB was returned by the camera. Thus using this table, we get a sense of what the RGB values returned by the camera means.
Please note, that the values are absolutely random. And the RGB values are not going to match exactly. But we can use mathematical interpolations, and extrapolations to find a close desired match.
The two figures below depict effects of applying interpretation data to an image.

Viewing on a display device
Calibrate and characterize the display. Objective is to view the colour captured by the camera accurately on a display device.
We do the same thing for display. Create a table for display like we did in the case for camera.
A Spectrophotometer is attached on the top. The monitor is then made to display several colour patches. The actual colour values outputted by the monitor is measured using the spectrophotometer.
This data is also stored in a table. So now we have developed two tables – one for the camera, and the other for display.

Now if we capture a real scene in camera, and camera returns an RGB value of (171,39,137), we can conclude that the actual colour value that camera was trying to capture could have been (80,58,-21).
From table 2, row 7, we can also conclude that to show an actual colour value of (80,58,-21) the display RGB should be 102,242,49.
Using this exercise, it is possible to display the colours accurately from nature to screen. (in practical scenario, the colour values are not going to match exactly. But we can use mathematical interpolations and extrapolations to find a close desired match)
Printing on a media
It is essential we calibrate the printing device. First, standardize the printing system. This means paper, ink, plate, screen resolution, screen angle, solid ink density, and other machine and environmental parameters are fixed.
Calibration is basically bringing the system to a known state. In this case, we calibrate to get the dot gain as per any standard we wish to follow. Thus we have also basically standardized our dot gain during calibration.
Using these standard values, a test chart is printed. Here the known stimuli are the CMYK values of each of the patches. Once printed, we measure the actual colour values of each patch and store it in a table. This table thus contains known CMYK value given for print, and corresponding output actual colour value for each of the patches.

Comparing table 1,2 we can conclude that, if CMYK for press is (10,63,81,1) the press is going to print a color whose value is (80,58,-21). This is equal to the color value corresponding to RGB value (171, 39, 137). This is one data point that the camera had returned when taking an actual image. Thus we have managed to print the same color as present in nature.
(The values mentioned in the tables are absolutely random and are generated by random number generator in excel. Do not use these values for any practical purpose.)
This is essentially what any color management system does.
Issues in “Capture –> Display –> Print”?
The devices used to capture, display and print have different colour reproduction capabilities, ie, they have different gamuts. Moreover, they use different colour systems. There are also many different device conditions and environmental variables. While calibrating the different devices we try to standardize most device and environment related parameters. Every time, any of the parameters change, the entire exercise of calibration and characterisation needs to be repeated.
In the entire process, we are using a lot of mathematical interpolations, and extrapolations. Thus we are taking a number of approximations.
Theoretically, as discussed, the solution to our problem seems quite possible, but practically we might not end up with exactly the same colour.
So, if after all this we take the printed sheet back to the exotic apple orchard and compare the reproduction with the original, most of us would be able to notice a slight colour variations. But we should not be disappointed with this difference. The above exercise takes us very close to the target in a very systematic and predictable way. And it works in a universal scenario.
Comparing this to a situation, where a photographer just clicks an image and does colour correction on an uncalibrated and non-characterised display device, and finally a printer prints it on an uncalibrated and unprofiled printing device (unfortunately this happens almost always), the outcome would be far worse than our colour managed methodology each and everytime.
By using colour managed methodology, we are at least confident that we would end up very close to the target.


 See All